By Rick Hamilton
Back in February, at the start of the researchfish submission period, we released an overview of our researchfish data alongside a refresh of our reporting webpage. Today, we are publishing the latest analysis of our researchfish data following the 2019 submission period.
During February and March this year our researchers, fellows and students were asked to report on the research outputs, outcomes and impact of their funding. This was the fifth year we have done this, and we starting to see patterns emerging in the ESRC researchfish data.
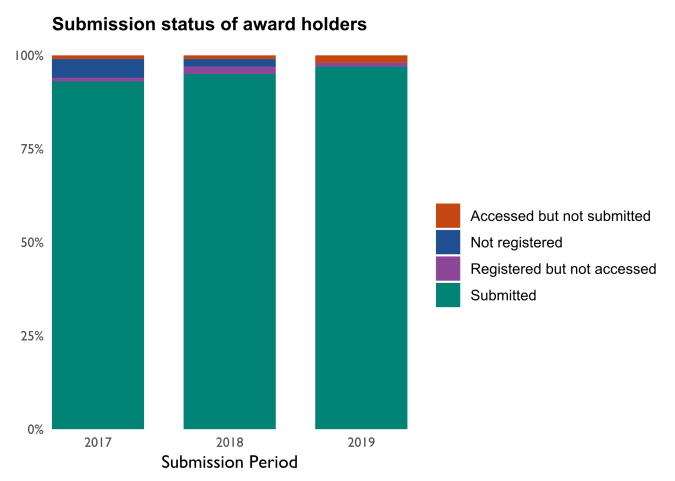
First of all, submission rates for award holders have continued to improve and, as the following chart shows, almost everyone required to make a submission does so. To measure this, we calculate a final adjusted compliance rate, which is the percentage of people expected to submit who did so, taking account those who make an optional submission. For our award holders, this rate currently sits at 96.7%. There remains a small number of award holders who access their researchfish account but don’t go on to make a submission.
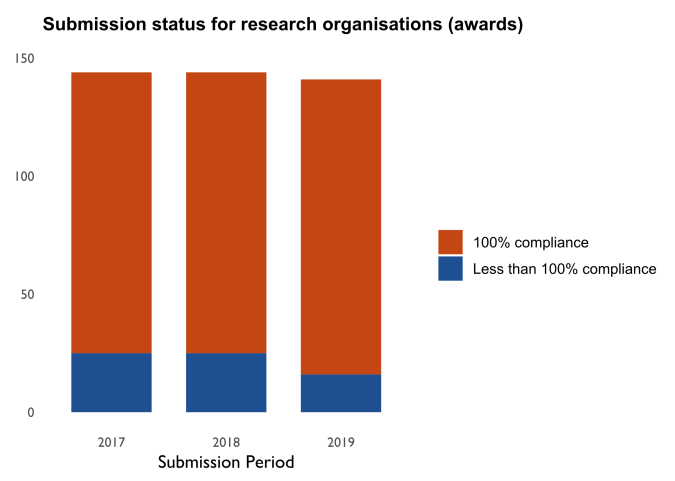
Our thanks go to all the award holders and students who spent time telling us about the outcomes of their funding, and to the staff at research organisations who coordinated these submissions. As the following chart indicates, most research organisations achieved a 100% compliance rate for their ESRC awards.
We previously reported that most outputs reported are either publications or engagement activities. This remains true, but we have observed a subtle shift over the past five years away from publications, which now account for 31% of outputs, down from 44% in 2014.
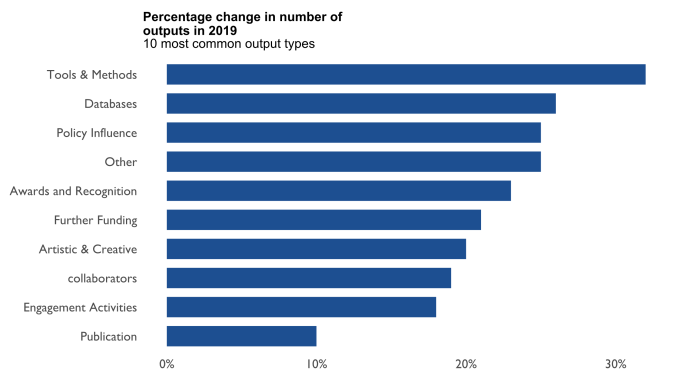
The following chart shows that the biggest increase in new outputs reported in 2019 was in the number of tools and methods, followed by databases and datasets. We had highlighted databases and datasets as an output that was underreported, and we appreciate the efforts taken to record
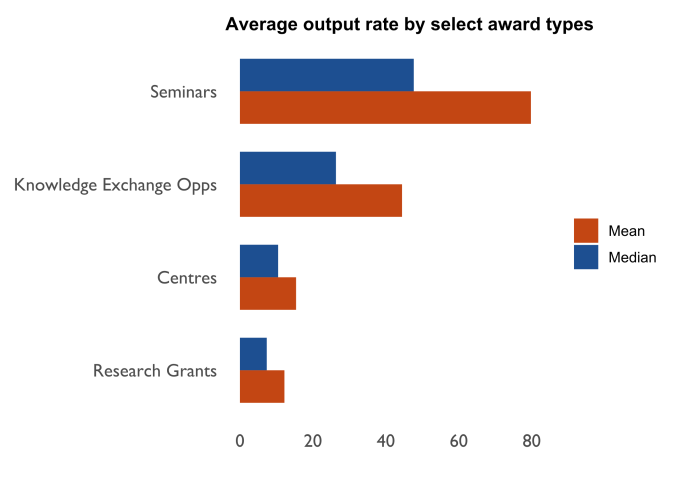
We are starting to explore the factors associated with output generation. What we know is that this is complex and can’t be attributed to something as simple as award size. For example, the output rate (the number of outputs reported per £100,000 of award value) varies across award types (see chart below).
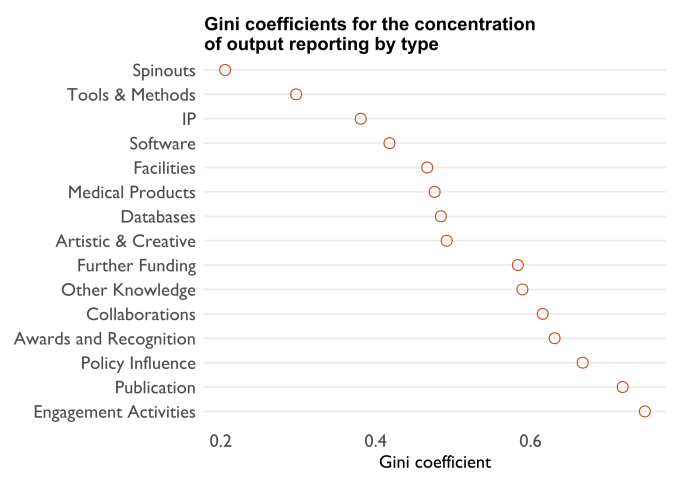
The nature of output reporting also varies across output types. This can be summarised using Gini coefficients , which are used in the following chart to measure the distribution of output reporting across our portfolio. A high Gini coefficient means that a small number of awards account for most of the outputs reported, whereas a low Gini coefficient indicates output reporting is more evenly spread across our portfolio. As can be seen, our highest volume outputs, publications and engagement activities, have a higher reporting concentration than other output types.
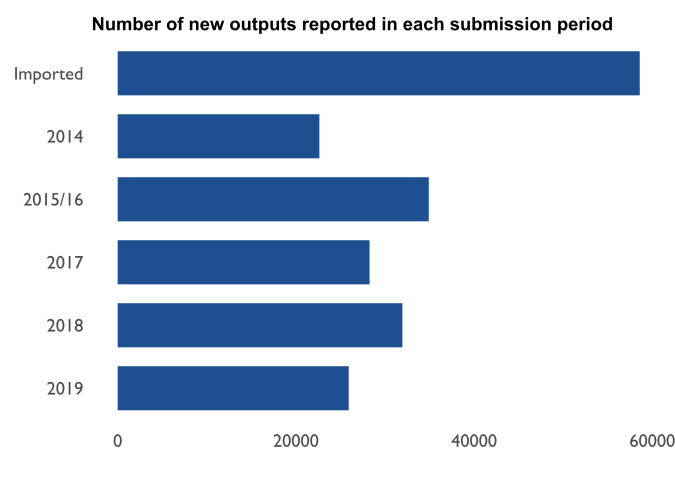
Finally, we have taken a look at how reporting has changed over the years. With five submission periods’ worth of data, certain trends can now be observed. In addition to the 60,000 outputs imported into researchfish from our previous system, the chart below illustrates that there is a steady number of new outputs reported – between 22,000 and 35,000 – each year (note that we only held one submission period covering 2015 and 2016).
An expected pattern is emerging from those awards that have now been reporting for the past five years. The following chart indicates that a relatively small number of outputs are reported in an award’s first submission period, with a big jump in the second year, and a steady decline each year after this. This suggests our reporting requirements, which begin in an award’s first year and end around five years after an award finishes are appropriate – clearly outputs start to be generated from the beginning of an award and are still being generated for years after this.

With five researchfish submission periods now completed, we are starting to build a consistent, long-term dataset of outputs information. The ability to track the outputs, outcomes and impact of what we fund over time is a valuable instrument in our ongoing role of demonstrating the value of social science funding.
 Rick Hamilton is a Senior Information Analyst in the Insights team in ESRC, which is part of UK Research and Innovation. He is responsible for undertaking analysis of ESRC’s portfolio, operations and research outputs.
You can find more analysis carried out by the Insights team on the ESRC website.
